情感时间表
Emotional Timeline
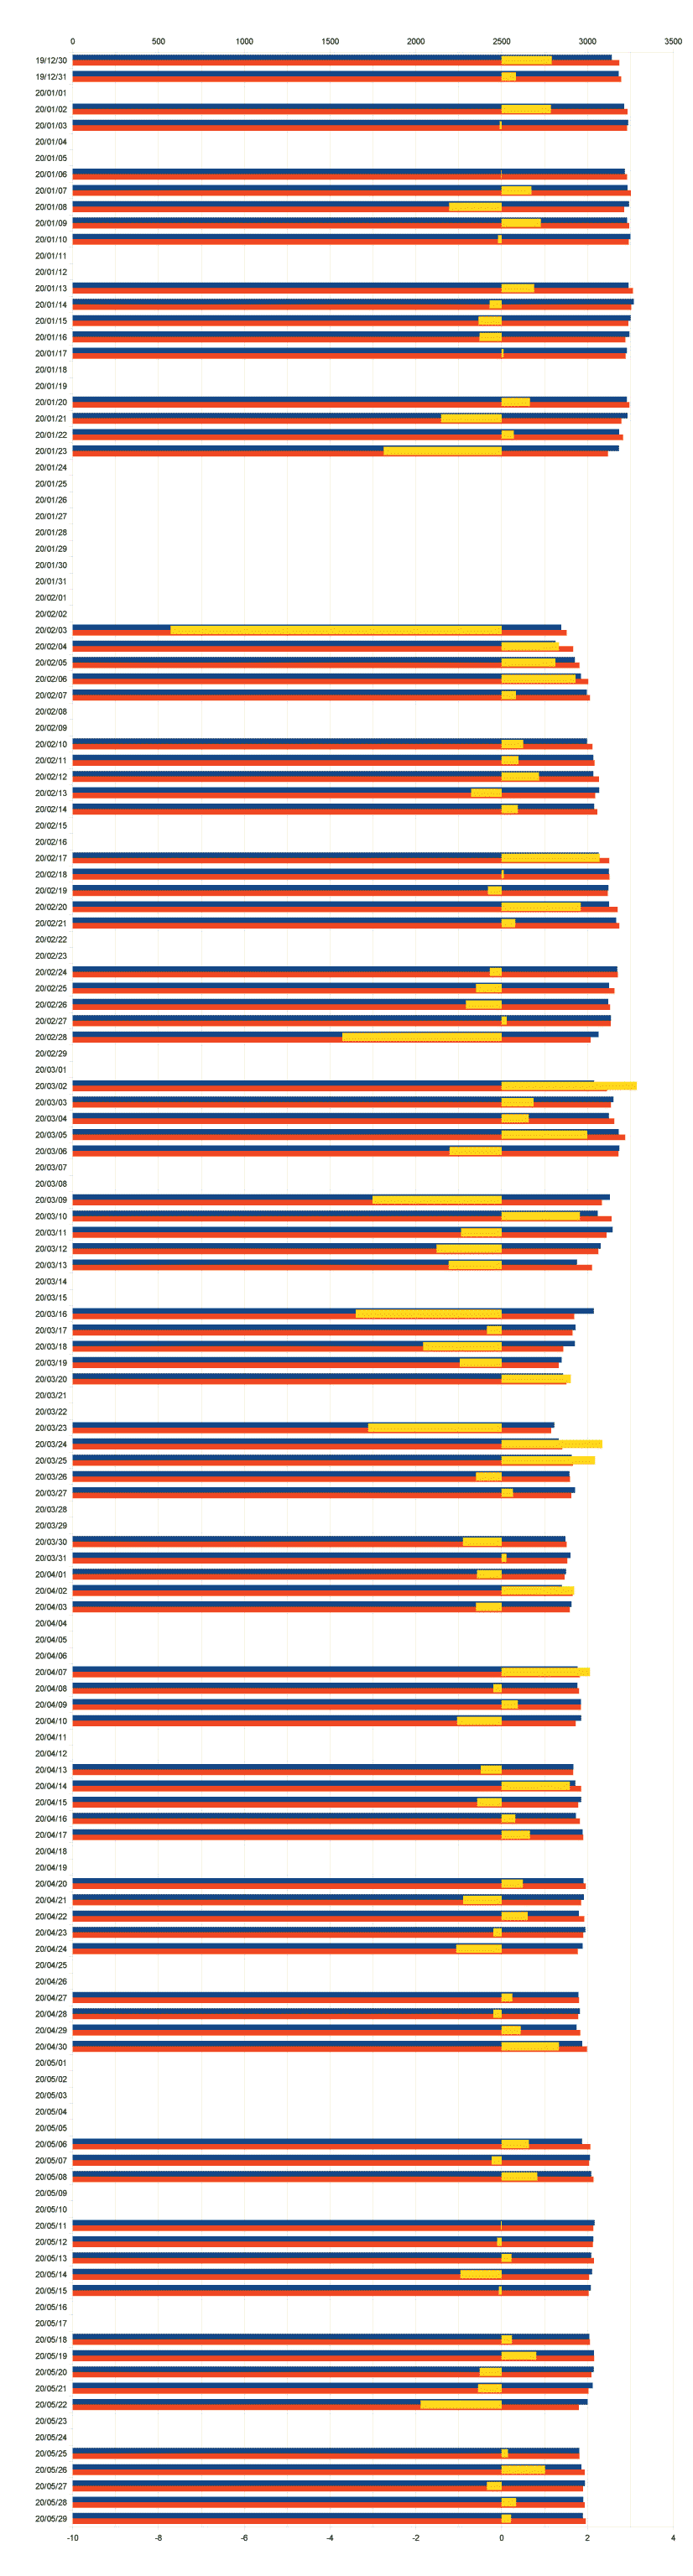
图片阐述了从2019年12月31日到2020年五月31日间中国股市的波动情况。图中红色部分代表了上海证券交易所A股指数,其中数字越大线条越长。上海证券交易所A股指数体现了在上海证券交易所上市的所有中国公司的股票价格。黄色部分代表了股票收益率,其中往左方向代表负数(损失)往右方向代表正数(收益)。股票收益率是投资于股票所能获得收益与原始投资额的比率同时也体现了股票投资的收益。
The graph illustrates the stock market fluctuation in China from December 31, 2019 to May 31, 2020. The red bars represent Shanghai A Stocks Index:The higher the number, the longer the line. Shanghai A Stocks Index reveals the day to day stock prices of all the Chinese public-listed companies in Shanghai Stock Exchange Centre. The yellow bars represent the Stock Return Rate: The left direction means negative (loss) and the right direction means positive (gains). The Stock Return Rate is the ratio of net stock incomes to the average stockholder’s equity, which basically represents the profits on the stock investments.

2019年 12月 30日
起点
成建芳
武汉市卫健委发布《关于做好不明原因肺炎救治工作的紧急通知》。遗憾的是,这份文件没有电子版本。
我的感受是:意识到似乎发生了一些严重的事情,我当时很好奇发生了什么。
December 30, 2019
The starting point
By Cheng Jianfang
Wuhan Health Committee Releases “Emergency Notice on Treating Pneumonia of Unknown Causes”. Unfortunately, this document is not available in electronic form.
My reaction: It seems that there is something serious happening. I’m just curious about what is going to happen.
2019年 12月 31日
黄茁静
我第一次听说这次新冠病毒是在新年前夜,当时它还被称作“武汉不明肺炎”。我在武汉的朋友告诉我她在微博上看到多人感染武汉不明肺炎的热搜,因此有点担心。我当时并不是太在意,还以为只是场普通的流感。
December 31, 2019
By Huang Zhuojing
New Year’s Eve was the day I first heard about the corona virus, which at that time was called “unknown Wuhan pneumonia”. It was my friend in Wuhan who told me that she read a news on Weibo that day: It was saying that few people had been showing symptoms of an unknown variety of pneumonia and she was a little bit worried. I didn’t really think about it that much because I thought it was just another kind of seasonal flu.
2020年 1月 22日
黄茁静
这一天我从南京坐火车回家过春节,通过网上的各种新闻和武汉人的描述,包括我在内的一些人开始意识到事情不太对劲。虽然上车前我决定要全程戴口罩,但是佩戴八小时的口罩属实有点窒息,期间我有几次摘掉口罩透气。我不断自我安慰:“我不会这么倒霉染上病毒的”、“只是武汉一带比较危险罢了”之类的。但是我很清楚内心深处我还是挺害怕挺慌张的。
January 22, 2020
By Huang Zhuojing
This was the day when I left Nanjing to go back to my hometown for winter vacation. That was the time when some people, including me, started to realize that something wasn’t quite right: What we saw on the internet about Wuhan and what we heard from our friends or families in Hubei Province was not comforting. Although I decided to to wear a mask while traveling, I still took it off sometimes. It was at times too suffocating during an 8-hour train. I kept thinking things like “I won’t be so unlucky to catch the virus” or “It’s dangerous just around Wuhan.” But deep down I was quite worried and sort of panicking.
2020年 01月 23日
武汉封城
成建芳
武汉疫情防控指挥部发布第1号通告,相关文件访问地址:http://www.gov.cn/xinwen/2020-01/23/content_5471751.htm
我的感受是:1月12日,我从南京经武汉返回重庆。我乘坐的火车在武汉停留了半个小时。武汉有很多人在上车。更糟糕的是,我没有戴口罩。到家后,我不敢出门。我非常害怕被感染,也害怕感染其他人,但幸运的是并没有。
January 23, 2020
Wuhan lockdown
By Cheng Jianfang
Wuhan Epidemic Prevention and Control Headquarters Releases No.1 Circular, and the document can be accessed at http://www.gov.cn/xinwen/2020-01/23/content_5471751.htm
My reaction: I returned to Chongqing from Nanjing via Wuhan on January 12. The train I took stayed in Wuhan for half an hour. There were a lot of people getting on the train in Wuhan. Even worse, I didn’t wear masks. After I got home, I did not dare to go out. I was very afraid of being infected, and I was also afraid of infecting others, but fortunately I was not infected.
2020年1月23日
股市震荡
杨欣芸
武汉在2020年1月23日10点封城,当天上海股票市场也因为春节而闭市,其指数并未被新冠肺炎所影响。但是当2020年2月3日股市重新开市时,当天大盘指数因为疫情原因降低240个点,(下降了7.8%)。
反应:我记得武汉被封城后,我身边那些并不觉得Covid-19可怕的朋友们才开始认真起来。我和我的同学们开始讨论春节后股市会以怎样的一种方式下跌,我们想到也许这是一个投资的好机会。那个时候,我们仅仅在担心病毒对经济的影响,以及能有什么样的策略来对冲这种负面影响。当时的我们都很乐观,没有想过这个病毒会持续这么久,谁也没有想到它最终演化成全球流行疾病。
January 23, 2020
Stock Market Decline
By Yang Xinyun
The Shanghai Stock Market was closed due to Chinese New Year holiday on Jan.23, 2020, the day that Wuhan declared its lockdown at 10am. The stock market had not yet reflected the influence of Covid-19 when it closed. However, on Feb.03, 2020, the first day of stock market opens after Chinese New Year, the index dropped ~240 (-7.8%) in reaction to Covid-19.
Reaction: I remembered the day after Wuhan lockdown: My friends who still didn’t think that the Covid-19 was horrible, started to take it seriously. With my classmates, we began to discuss how the stock market would possible go down after Chinese New Year, and we started to think that perhaps it was a good time to start investing. At that time, we were only worried about how this virus would influence the market and what strategies can be taken to counteract such a negative impact. We were still optimistic about this virus and its lasting, but none of us thought it would evolve into a pandemic.
2020年 1月 24日
在我的家乡
成建芳
我的家乡重庆市启动了重大突发公共卫生事件的一级响应,相关文件访问地址:http://www.cq.gov.cn/zwxx/jrcq/202001/t20200125_4785639.html
我的感受是:当时,疫情几乎已经蔓延到全国各地。上一段所提到的文件明确要求:限制或者停止集市、集会、影剧院演出以及其他人群聚集的活动;停工、停业、停课;封闭或者封存被传染病病原体污染的公共饮用水源、食品以及相关物品等。由于政府采取的限制措施,我只能呆在家里,不能出去,所以我不用担心被感染。然而,我仍然为其它地方的人们祈祷,希望疫情能够尽快得到控制,每个人都安全健康。有时当我在网上看到一些人不听劝阻强行外出的消息时,我感到非常生气。
January 24, 2020
In my hometown
By Cheng Jianfang
My hometown, Chongqing, launched the first-class response to major public health emergencies, and the document can be accessed at http://www.cq.gov.cn/zwxx/jrcq/202001/t20200125_4785639.html
My reaction: At this time, the epidemic situation has spread almost all over the country. The document mentioned in the previous paragraph requires to restrict or stop fairs, assemblies, theatrical performances and other crowd gathering activities; to stop work, to suspend business and classes; to closed or seal public drinking water sources, food and related items contaminated by infectious disease pathogens, etc. Since I can only stay at home and can’t go out because of these restrictive measures, I really don’t have to worry about being infected. However, I still pray for people in other places, hoping that the epidemic situation can be controlled as soon as possible and that everyone is safe and healthy. Sometimes I get very angry when I see news on the Internet that some people do not listen to public advices and have to go out.
2020年 2月
与家人共处的兴奋
林乙仙
好久没跟爸妈在一起那么久,现在学校说要延迟开学,我很兴奋,因为我可以多跟爸妈在一起陪陪他们,而且学校说的线上课程究竟是什么样子的呢?
February, 2020
Excited to be with family at home
By Lin Yixian
It’s been a long time since I’ve been with my parents for so long. Now the school says that the beginning of the semester will be delayed. I’m very excited because I can spend more time with my parents and stay with them, and what does the school say about the online courses?
2020年 2月 2日
黄茁静
专门收治新冠肺炎患者的火神山医院在这一天正式交付。在过去的两周里,我在网上听不同的人们述说他们的经历,尤其是待在武汉的人。我感到既无助又伤心,不仅是因为我什么都做不了,还因为我在武汉度过了四年时光,对这座城市十分熟悉,因此这也让我对这次武汉封锁的感觉比没有去过武汉的人要强烈一些。
February 2, 2020
By Huang Zhuojing
The Huoshenshan Hopital, dedicated solely to people infected by COVID-19, was built this day. During the last two weeks, I had been reading different people talking about their experience on the internet, especially people who stayed in Wuhan. I felt so helpless and distressed not just because I couldn’t do anything to make things better, but also because I spent the last four years in Wuhan for my Bachelor’s degree so I am so familiar with the city. This in turn made my feelings even stronger towards this pandemic.
2020年的 2月 3号和 2月 4号
对应措施
杨欣芸
为了应对股票市场的动荡,央行紧急出台了政策,投放1.7万亿元资金进入金融市场。
反应:政府和大型商业机构采取行动以最大程度地降低股票市场下跌的损失,介入金融市场是政府采取的真正极端的行动。经过政府和公司的努力,股票市场好像被控制住了。想到这些动荡的日子,我就感到不安和焦虑。
February 3 and 4, 2020
Correspondence
By Yang Xinyun
The People’s Bank of China (PBOC) released ~RMB$170 billion into stock market on Feb.3 and Feb.4, 2020 to counteract the significant drops in stock market.
Reaction: The government and large businesses took actions to minimize the loss caused by stock market drops. Interfering with the financial market is a truly extraordinary action that the government has taken. After the effort made by government and companies, it appears that the stock market is under control. I felt unsure and worried in thinking about these uncertain times.
2020年 2月 7日
焦虑:开学与否
林乙仙
寒假期间,因为中国疫情严重,学校并未通知是否返校。那时,我感到了焦虑。一方面,我担心回学校会加快疫情的扩散,使得疫情不好控制;另一方面,也担心待在家我会偷懒,会落下老师要求我们做的研究。
February 7, 2020
Anxious about whether to start school
By Lin Yixian
During the winter vacation, because the Chinese epidemic was severe, the school had not yet notified whether to return to school. At that time, I felt anxious. On the one hand, I was worried that returning to school would speed up the spread of the epidemic, making it difficult to control it. On the other hand, I would be lazy when at home. I’ll probably neglect the research that our teacher asked us to do.
2020年 2月 28日
石油市场冲击
杨欣芸
新冠肺炎已经扩散到了全球,欧洲和美国的股市也在走低。因为在全球市场上OPEC对石油市场价格的不及时调整影响到中国石油市场,导致下跌了4.3%。上海股票市场也被影响,显示出3.7%的跌幅。
反应:新冠肺炎的全球爆发使我感到非常焦虑,它影响了金融和经济领域的很多方面。股市对金融市场中的变化一直是很敏感的。当我在短期内看不到新冠肺炎的尽头时,我会想:市场如何应对新冠肺炎的扩散?
February 28, 2020
Oil Market Impact
By Yang Xinyun
On Feb. 28, 2020, the Covid-19 has spread globally, the stock markets of Europe and US were going down. The Chinese oil market also went down 4.3% due to OPEC’s slow reaction to adjust the oil prices with respect to the global market. The Shanghai Stock Market has been influenced and showed a 3.7% decline.
Reaction: I felt anxious as the Covid-19’s global outbreak would significantly influence many different fields in finance and economy. The stock market is sensible to changes in financial markets. I cannot see the end of the Covid-19 pandemic in the short time: How would the market react to the Covid-19’s spreading?
从 2020年 3月 9日到 2020年 3月 18日
四次熔断
杨欣芸
新冠肺炎在美国的爆发导致了美股在十天内熔断四次。上海股市紧随美股也下跌了。
反应:震惊!对世界来说,这简直是历史时刻!美股在历史中只熔断过一次。肺炎期间的金融形势比金融危机还要严重。许多上市公司受到影响,他们的资产在短短几天内缩水严重。让人难以置信的场景! 我开始想,下面还会发生什么?还会更糟糕吗?Negative Oil 石油价格负数
From March 9 until March 18, 2020
Four Times Halts
By Yang Xinyun
As the Covid-19 outbreaks in North America, the US stock market halts 4 times in 10 days from March. 09, 2020 to March 18, 2020. The Shanghai Stock Market dropped along with US stock market.
Reaction: Shocked!What a historic moment for the world! The US stock market halted only once in the past. The economic situation is worse during the pandemic than it has been during times of financial crisis. Many publicly listed companies have been affected and their market value decreased significantly in just few days. Unbelievable scene! I wondered what would happen next. Could it get even worse?
2020年 3月 15日
踌躇于未来
林乙仙
我对未来感到困惑和犹豫。来自中国国家统计局的数据显示,所有工业活动在去年2月都明显萎缩。大流行不仅影响人们的健康,还影响经济增长。
March 15, 2020
Hesitating about the future
By Lin Yixian
I am feeling confused and hesitant about the future. Data from the National Bureau of Statistics of China show that all industrial activities shrank significantly last February. The pandemic does not merely affect people’s health, but also economic growth.
2020年 4月
惦记着在国外被隔离的亲朋好友
林乙仙
我的姐姐现在国外,因为疫情她现在只能待在家里。我很担心她在隔离期间丢掉工作,没有收入。她生活过得怎么样?我最好的一个朋友患有焦虑症,他也在国外被隔离了。现在的他没办法每天到实验室工作,他担心着他的实验,很焦虑,我很担心他的情绪。
April, 2020
Worried friends and family separated abroad
By Lin Yixian
My sister is abroad, and she can only stay at home because of the epidemic. I am very worried about how she lived without any income during her quarantine period. Also, my best friend suffers from an anxiety disorder. He is also isolated abroad. Now he cannot work in the laboratory every day. He is very worried about his experiment and he is very anxious, and I am very worried about his emotions.
2020年 4月
关于摩擦的遗憾:与家人相处太久
林乙仙
已经很久没有在家待那么久了,现在有点不习惯,感觉常常会跟爸妈产生不必要的摩擦,所以我搬出来了。有点失望和遗憾,原本以为现在是个跟家人相处的好时机呢。
April, 2020
It’s a pity that getting along with my family for too long will cause friction
By Lin Yixian
It’s been a long time since I’ve been at home for so many days, and I’m not used to it now. I often feel unnecessary friction with my parents, so I moved out and was a bit disappointed, and felt sorry. I thought it was a good opportunity to get along with my family.
2020年 4月 4日
我们都记得
成建芳
国务院公告:举行全国性哀悼活动,相关文件访问地址:http://www.gov.cn/xinwen/2020-04/03/content_5498489.htm
我的感受是:向因为这一流行病牺牲的英雄们致敬,向因这一流行病而丧生的同胞们告别。我们将永远记得你们。死者安息,生者奋斗。
April 4, 2020
We will remember you
By Cheng Jianfang
Announcement of the State Council: National Mourning Activities Held on April 4, 2020, and the document can be accessed by http://www.gov.cn/xinwen/2020-04/03/content_5498489.htm
My reaction: We are paying tribute to the heroes who have sacrificed their lives for this epidemic and bidding farewell to the compatriots who lost their lives because of it. We will always remember you. The dead rest in peace, the living are still struggling.
April 4, 2020
By Huang Zhuojing
Although I had been hearing news about going back to school since the end of February, this time it seemed that we were really going back in two weeks or so. It looked that things were getting back to normal in Nanjing. Many shops started to reopen and you could see people going out again. However, we were told that even if we were going back to the school, we would have not been allowed to go outside freely: Online classes would have still continued. I was quite confused and worried at that time, thinking that perhaps it would have been better to just stay at home, since we were not actually going back to the classroom.
2020年 4月 4日
黄茁静
从二月底开始就有关于返校的传闻,但是根据政府的消息,这回我们似乎真的可以返校了。在南京,一切好像又开始重回正轨——-许多商店重新开业,人们也纷纷出门。但是我们被告知即使返校,也不能自由出入,并且将继续上网课。我当时挺疑惑的,既然不能去教室上课,为什么不直接待在家里就好了呢?
2020年 4月 8日
武汉回来了
成建芳
武汉离汉离鄂通道管控措施正式解除,相关文件访问地址:http://www.hubei.gov.cn/zhuanti/2020/gzxxgzbd/zxtb/202003/t20200324_2189256.shtml
我的感受是:我们度过了疫情最艰难的阶段。一切重启,新的篇章,新的未来。凛冬消散,雪融草春。武汉和春天一起回来了。
April 8, 2020
Wuhan is back
By Cheng Jianfang
Access to Wuhan has been reestablished, and the document can be accessed by http://www.hubei.gov.cn/zhuanti/2020/gzxxgzbd/zxtb/202003/t20200324_2189256.shtml
My reaction: We have survived the most difficult phase of the pandemic. Everything will restart: A new chapter, a new future are ahead of us. Winter dissipates and snow melts into grass and spring. And Wuhan comes back to a new spring.
2020年 4月 12日
石油价格负数
杨欣芸
在全球的石油市场惨淡时,2020年 4月 12日石油价格跌至负值。
反应:当我听到这个消息时真的太惊讶了。 我从来没有听说过石油相关的金融产品跌到过负数。这在我们的金融史上简直是一个新的 历史时刻。讽刺的说,我觉得这次新冠肺炎把很多不可能变成了可能。当这件事发生的时候,我的教授和同学们都无法不去讨论它,我们会去猜想它的后果以及对中国的影响,但是我不知道怎么解决。对于那些买了相关金融产品的人,我能体会到他们的绝望。
April 12, 2020
Negative Oil
By Yang Xinyun
In response to huge exchange contraction in its market, the price of oil dropped to negative on April.12, 2020.
Reaction: When I heard about this news, it surprised me. I never heard that oil related financial products can be negative. This is like another historical moment in our financial history. Ironically speaking, I feel that the Covid-19 has made the impossible possible. When this happened, my professors and friends can’t help but talk about it. I had many guesses about its consequence and impacts on China, but I had no clues about its solution. For people who bought such financial products, these are desperate times.
2020年 4月 27日
黄茁静
这一天我们终于被告知这学期我们将使用全程网课的方式上课。如果是在二月或者三月,有人告诉我许多大学将停摆半年,我是不会相信的。但是这确确实实发生了,而我们也只能接受事实。此外在这一天,美国的新冠感染人数突破了百万,我看到有些人在中文社交媒体上称这次病毒是“美国病毒”,我对此感到挺生气的。我认为这种仇恨、不公不应该发生在任何地方。
April 27, 2020
By Huang Zhuojing
We were finally told that we were going to keep doing online classes for the whole semester. If someone would have told me in February or March that the whole semester was going to be like this, I wouldn’t have believed it. But this is how things are, and we have to accept it. This was also the day when the U.S. had more than a million cases in total since the pandemic started. I saw someone on Chinese social media calling this virus an “American virus”, which made me really angry because this kind of hatred and discrimination shouldn’t have happened no matter where in the world.
2020年 5月 1日
希望
杨欣芸
五月份上海股票市场大盘呈现稳定趋势。因为央行通过不断对企业释放商业贷款,持续宣布支持经济实体,推动资金流入资本市场。
反应:当整个中国的商业和交通都在复工时,股票市场也在渐渐恢复。我发现即使新冠肺炎并未结束,但是我们正在恢复以前的生活。有时候我会担心如果我们将要和这个病毒在未来共生存。但是现在我看到了希望,因为我们总能找到方式去适者生存。
May 1, 2020
Hopes
By Yang Xinyun
In May, the Shanghai Stock Market kept stable trends. PBOC progressively announced supports to business entities by releasing more commercial loans, which assisted the cash flow of capital markets.
Reaction: Just like businesses and transportations are resumed in China, the stock market appears to be resumed as well. I found that we are recovering although the Covid-19 has not ended yet. Sometimes, I worried if we have to live with the virus in the future. But now, I see hopes because there is always a way to adapt.
2020年 5月 10日
疫情还在
成建芳
舒兰市风险等级由中风险调整为高风险。相关文件访问地址:http://wsjkw.jl.gov.cn/xwzx/xwfb/202005/t20200510_7205375.html
我的感受是:就在我们以为一切即将归于平静的时候,病毒告诉我们它还在,由此告诫我们,不能放松警惕。直到今天,我仍然尽量避免外出,如果一定要出去也一定会戴好口罩,保护自己,也是保护他人。
May 10, 2020
The pandemic continues
By Cheng Jianfang
The risk level of Jilin Shulan is adjusted from medium risk to high risk, and the document can be accessed at http://wsjkw.jl.gov.cn/xwzx/xwfb/202005/t20200510_7205375.html
My reaction: Just when we thought that everything was going to be peaceful, the virus told us that it was still there, thus warning us not to relax our vigilance. Even now, I still try to avoid going out. If I have to go out, I will wear a mask no matter where I go.
2020年 5月 10日
黄茁静
当许多中国人觉得局势在中国已经得到了有效控制时,一些东北的城市重新把风险等级调到了高风险,这让我又重新开始担心感染上病毒的可能性,同时也提醒了我这次疫情还远未结束。
May 10, 2020
By Huang Zhuojing
When many Chinese people thought the virus had been under control in China, some cities in the Northeast had announced that they were back at high risk level again. The feelings of being afraid of catching the virus came back to me again. This also reminded me that the virus hasn’t really gone away anywhere in the world.
2020年 6月 1日
沮丧:一些发展中国家的情况
林乙仙
全球有许多人因COVID-19的并发症而丧命。但是,对经济的关注和大衰退的风险还正在引导政府的行动。听到这些消息,我感到非常沮丧。特别是在发展中国家,经济发展和疾病预防这二者之间存在一种悖论:需要在挽救生命和经济繁荣之间做出选择。
June 1, 2020
Frustrated with the situation in some developing countries
By Lin Yixian
Across the globe, many are dying as a result of complications from COVID-19. However, economic concerns and risks of massive recession are also guiding the actions of governments. I feel so frustrated when hearing about these news. There is a paradox in economic development and disease prevention, especially in these developing countries: They need to choose between saving lives and economic prosperity.